

Issue #20 - Centralization in Value Added Agriculture
Issue #20 - Centralization in Value Added Agriculture
Modern Organizational Theory for Modern Times


Everybody Wants to Rule the World - Tears for Fears
Organizational Theory and agriculture? Sign me up!
Over the next several posts we’re going to take a bit of a deep dive on the concept of Decentralization.
You might be asking yourself … ummm … why?
And I wouldn’t blame you for that. It seems like a bit of a hard left (or is it right?) turn from the kinds of industry and entrepreneurship posts so far. Though … geez … that last one on project management, prioritization, and … ducks? … got a bit wild, eh?
But, what does decentralization have to do with the things you’ve tuned in1 to read about: farming, sheep, and consumer goods? By the end of this, I hope you’ll agree with my central theory that decentralization might be the Philosophers’ Stone2 of agricultural systems.
Decentralization has been in the news lately. For example, in the wake of Twitter shooting itself in the foot3, the primary benefactor has been a social media app called Mastodon. Mastodon considers itself “federated” - a form of decentralization. And, maybe you’ve heard of the blockchain? You know, the distributed ledger that is the backbone of cryptocurrencies, NFTs, and smart contracts? “Distributed” is also a form of decentralization.
Why do people organize into groups? How does that organization make decisions? What resources does the organization need? etc. “Organization” here might mean “a company” but it also might mean “a nation” or even just “a group of people with a common goal.” In my case, I mean “agricultural industry participants” in a general sense, and “sheep farmers” in a more specific sense.
In prior posts we’ve hinted at harms in the wool industry, we’ve talked through harms in the meat industry, and we’ve mostly sidestepped the thicket of the dairy industry. We’ve largely discussed these issues as “supply chain” issues. But “supply chain issues” are a symptom of the underlying disease: centralization and its kissing cousins economies-of-scale and division of labor.
Value Added Agriculture is Centralized
They say pictures are worth a thousand words, so here’s 4 pictures so I don’t have to write 4,000 words. These pictures show the supply chains of meat (beef and hogs) in the United States and (wool) garments4.

Citation: Slaughter and Processing Options and Issues for Locally Sourced Meat. USDA. June 2012.
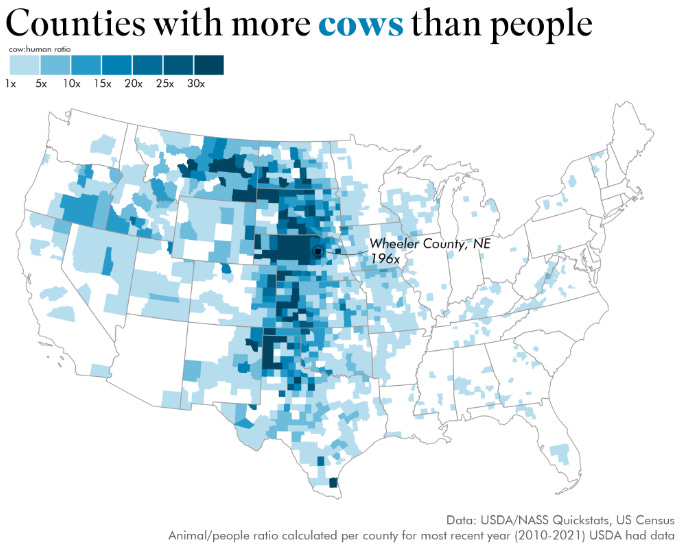
Citation: Davis, Erin R. Where is there more livestock than people? Data Stuff. June 21, 2022.

Citation: WARDROBE.NYC launches Release 05 Tailoring with traceable Merino wool. Woolmark.com.

Citation: Duckworth American Supply Chain. Duckworth.com
And centralization is increasing (particularly in the United States).
As of 2021, only 20% of [Western Hemisphere] countries’ textile imports came from within [the Western Hemisphere], down from 26% in 2015. [While], in 2021, as many as 82% of Asian countries’ textile imports came from within Asia, up from 80% in 2015.
Lu, Sheng. WTO Reports World Textiles and Clothing Trade in 2021. Sheng Lu Fashion. December 2, 2022.
In other words, textiles/garments are centralizing in Asia.

Citation: WorldMapper. https://worldmapper.org/maps/sheep-2016/
You can see a similar phenomenon in the two graphics related to beef production. The first map shows almost all of the United States’ meat production in four states: Nebraska, Kansas, Oklahoma, and Texas. The second map shows where all of the cows being processed come from. Do you want to guess? Yeah: Nebraska, Kansas, Oklahoma, and Texas.
For cattle, 14 plants account for the majority (greater than 55 percent) of U.S. slaughter.
USDA. Slaughter and Processing. Supra. [emphasis added].
Yet, this is somewhat misleading. Obviously, not all cows come from Nebraska, Kansas, Oklahoma, and Texas. As this map shows.

Citation: Manore, Fair, and MacHymen. Disease properties, geography, and mitigation strategies in a simulation spread of rinderpest across the United States. Veterinary Research. March 2011.5
See? We have plenty of cows in Wisconsin (or at least had - note the map was for 20076 data). Compared to processing, raw material production (i.e., raising livestock) is more spread out, even if concentrated around processing centers (or are the processing centers concentrated around the farms).
That’s illustrated by this map, showing regions where there are cattle, but no slaughter/processing facilities.

Citation: Mapping Slaughter Availability in US. USDA. Aug 16, 2021.7
In other words, all of the power and decision-making authority is concentrated in a specific place or organization. If you want wool processed, you send it to China. If you want beef processed, you use one of 14 processors in the Central United States. Processing power is consolidated into a small group of people.8 These systems are centralized.
Centralization isn’t inherently bad. In some cases, it is even desirable. In our next article we’ll explore the organizational concept of centralization and why the industry turned out this way. Then we’ll turn our attention to what, if anything, can be done about it.
Check 1.2. Is this thing on? You’re still here, right? Maybe I should write more often. People might stick around…
tldr; In the days when people believed in alchemy, the Philosophers’ Stone was the substance that would turn metals into gold.
And face. And hand.
For a really cool resource, check out VF Company’s traceability maps. VFC makes well-known brands such as Altra, Dickies, Eastpak, North Face, Timberland, Vans, and numerous other brands that you would know. https://www.vfc.com/responsibility/product/traceability-maps
This is technically a map of density per farming hundredacre, not a map of cattle population. So, one thing that is a bit misrepresented by this map is that the plains states have a much higher population but the whole land area is run by cattle, so the density is relatively low (but check out Nebraska and Arkansas!); whereas in Wisconsin, for example, not all land is farming but the farms that exist have a lot of cows on them, so population is low(er) but density is high(er). But notice that Wisconsin has a lot of yellow squares (state meat processors) but not a lot of red squares (federal processors), while the plains states are the opposite.
I tried to generate more recent data but the USDA/NASS systems wasn’t playing nicely and I didn’t feel like dusting off my version of Tableau for this.
This shows both state and federally inspected facilities. The prior map only showed federal facilities. In short, meat cannot be transported across state lines if it is not processed in a federally inspected facility. State facilities, as a rule, are much smaller and as we’ll see in later posts, tend to be much more constrained for capacity.
Relatively speaking, of course. There are thousands of wool processors around the world. But on the aggregate most of it is done in China by a small fraction of the total number of global processors. Similarly, there are thousands of meat processors in the US; but over 55% of it is performed by just 14 of them.